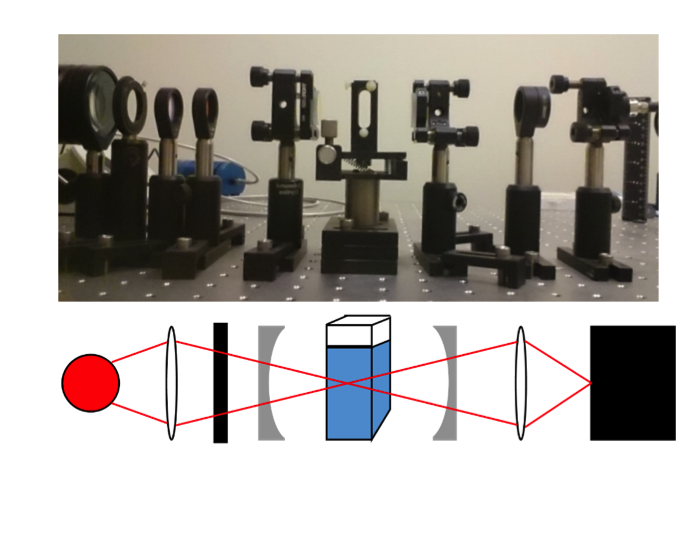
Absorption spectroscopy is popular form of chemical identification and characterization. Typically, light is passed through a sample once and the intensity of the light after passing through the sample is measured. If light is absorbed by a sample, we expect the amount absorb to increase if the concentration of the solution or the thickness of the solution is increased. Absorbance is defined so that we expect the amount of light absorbed to have a linear dependence of thickness and concentration.
Sometimes samples do not absorb a lot of light, so measuring their weak absorbance is difficult. To solve this problem, cavity-enhanced absorption spectroscopy can be used. This method uses a set of mirrors placed around the sample to reflect light through the sample multiple times. This effectively increases the thickness of the sample, making the observed absorbance stronger and more easily measurable. However, this method has been seen to break the linear relation between absorbance and concentration. Instead of seeing a straight line when plotting absorbance versus concentration, they see a curve.
My junior independent study work was to investigate the absorbance dependence on thickness. I used a cavity-enhanced method and a typical single pass method to take absorbance measurements for varied sample thickness. I varied the thickness by using different sizes of sample container. From my experiments, I saw the predicted linear behavior for the single pass data. However, for my cavity-enhanced data I saw a curved trend like had been observed previously for varied concentration. This tells me that the amount that the cavity enhances the measurement depends on how much absorber or sample the light must pass through.
